
|
Charts for the Java[TM] platform |
| Home |
| Examples |
|
Note: you will find many more examples in the evaluation version you can download.
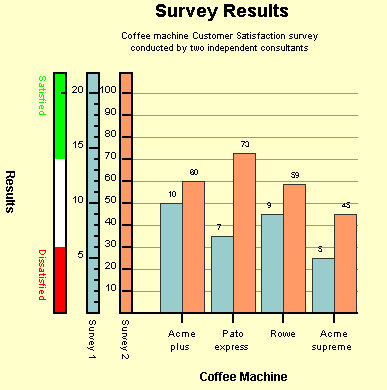
Columnchart with several y axis and target zones.
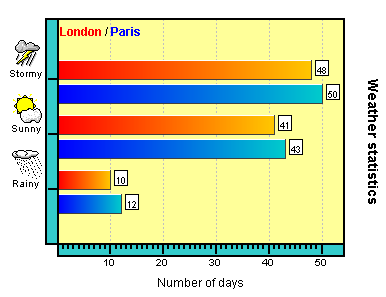
Barchart with images, gradient filling and user defined labels
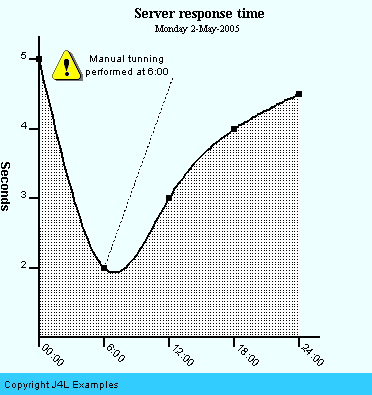
Curves with pattern filling , note (which includes an image), note at the bottom (copyright) and rotated text.
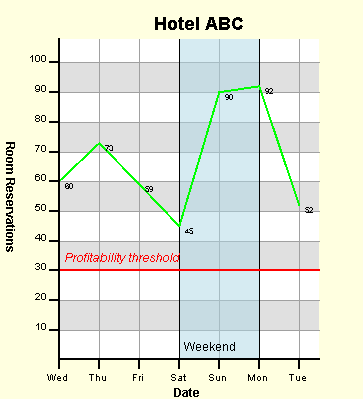
Linechart with horizontal and vertical target zones.
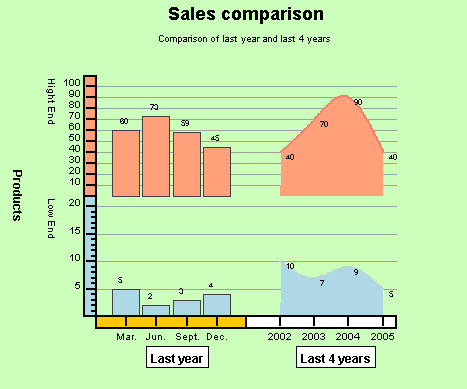
Subcharts using stacked axis
Linechart on the top of a barchart using stacked axis.
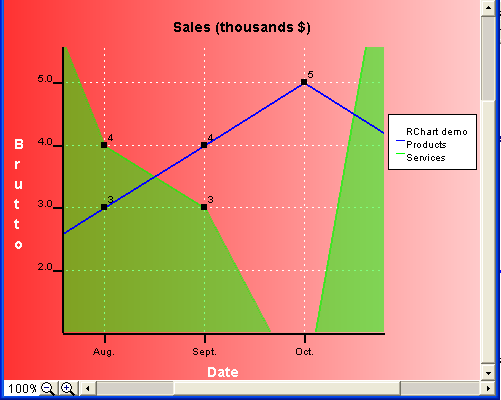
Line chart (with scroll and zoom).
Column chart.
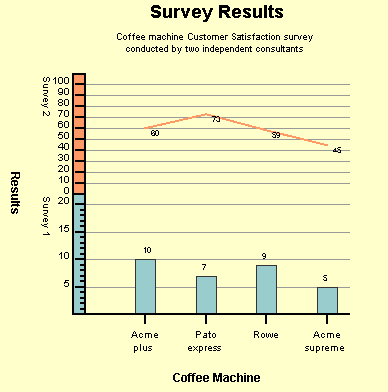
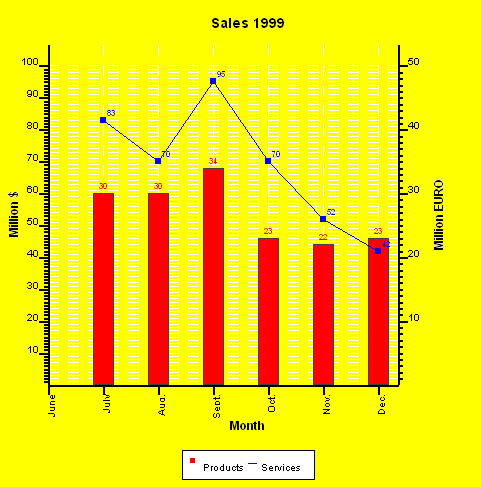
Combined chart with two Y axis and vertical text.
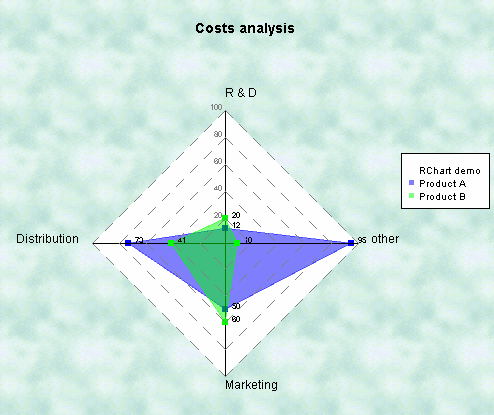
Radar chart (transparent filling).
Stack chart.
Curve and Least Squares Line. Images as points.
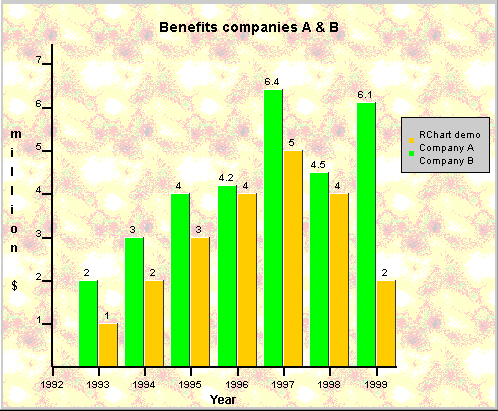
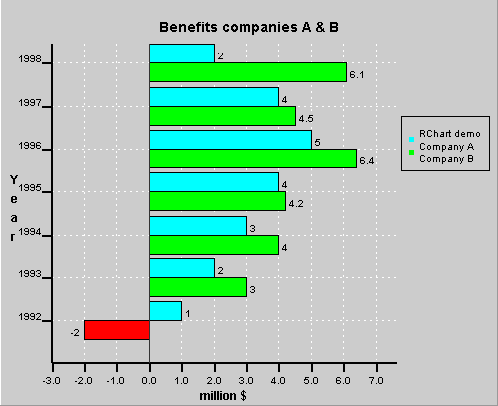
Bar chart.
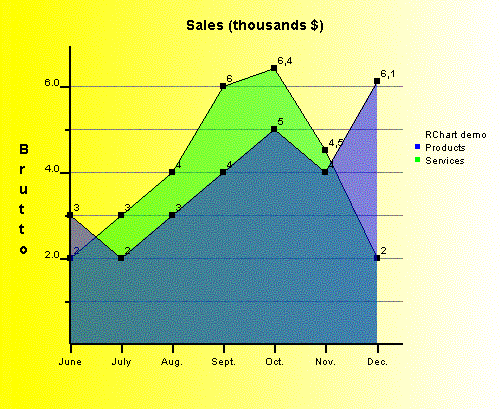
Area chart.
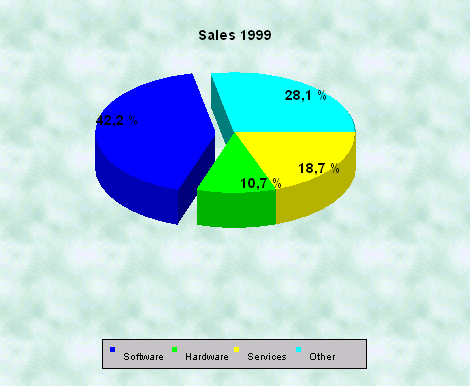
Pie chart(3D).
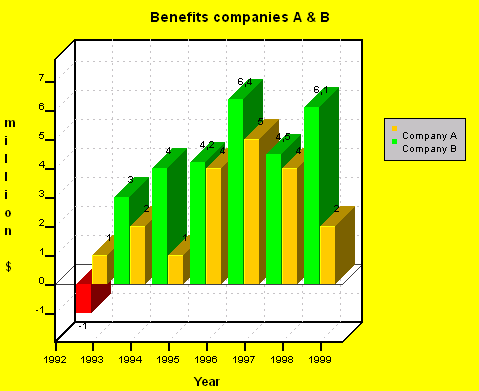
Column chart 3D.
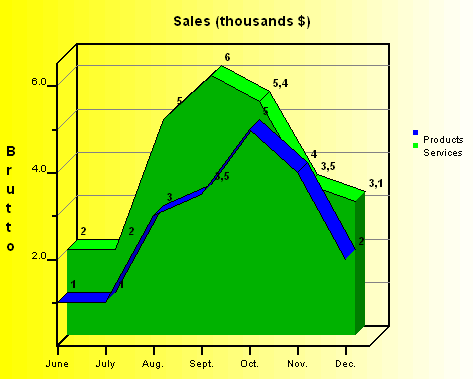
Line/area chart 3D.
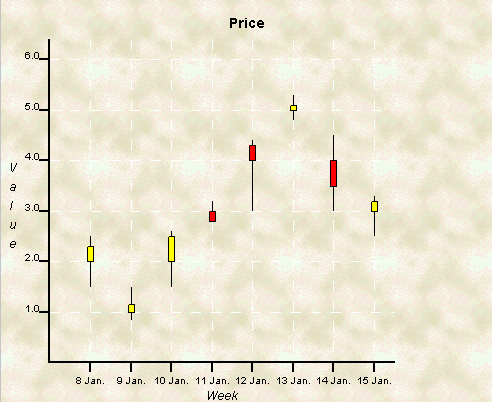
Candlestick.
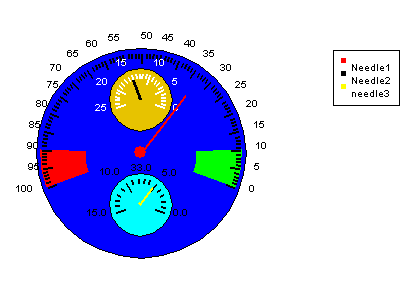
Gauge.
|
| Copyright © 2000-2018
Java4Less.com. About
us. Oracle, APEX, Java, JSP, JDBC, JDK and all Java-based marks are trademarks or registered trademarks of Oracle and/or its affiliates. J4L Components is independent of Oracle. |