RCHART, User Guide
Copyright 2005, J4L
Components (http://www.java4less.com)
Go bak to contents
RChart , first steps.
Installation
The installation of RChart
is very simple:
- Either you download
the evaluation version from http://www.java4less.com
or you have received the registered product per email.
- Unzip the file you have
downloaded in an empty directory. Make sure you unzip also the subdirectories.
You can now open the following
files:
- UserGuide/tutorialcontents.html:
opens this user guide.
- bin/VisualBuilder.bat:
starts Rchart visual builder.
- examples_swt/run.bat:
starts the SWT sample application (you must first edit it and change the SWT_JAR
and SWT_LIB variables so that they point to your SWT installation).
- examples_swing/run.bat:
starts the Swing sample application. Swing is included in JDK 1.3 and later.
If you use JDK 1.1 or JDK 1.2 you must copy swingAll.jar to the directory
before running the file.
- examples_awt/run.bat:
starts the Awt sample application.
- examples_jsp: contains
the JSP sample application
- examples_servlet: contains
instructions for the use of the servlet
- examples_applet/examples.html:
applet examples
- JavaDoc/index.htm: open
the javadoc help files.
Requirements
RChart will work with:
- JDK 1.1 (some features
like transparencies are not available)
- JDK 1.2 or later
- If you use SWT, it has
been tested with SWT 2.1 and 3.
Where
to start
As starting point we recommend
you not to create a chart from scratch but to take one of the examples we provide
and start working by modifying it.
But first of all you must
be aware that there are 2 ways to create a chart:
- either you create it
using the Java API, creating the RChart java objects and setting the
properties (see File bin/ChartExamples.java)
- or you create the chart
by means of the ChartLoader. In this case you do not have to worry
about the Java API. You just have to create a list of parameters and use the
ChartLoader class to create the chart (see examples in directory data/examples).
We recommend you to use the
second approach (using the ChartLoader) for the following reasons:
- You can create the parameters
for the ChartLoader using RChart Visual Builder.
- It is easier to learn.
- It is easier to develop
and debug.
- You can reuse the java
code since the same code can load different charts.
Nevertheless this guide
provides both the parameter names and the equivalent Java class and property.
If you want to use the
RChart in a:
Format
of the parameters
If you are going to create
you chart by mean of the chart loader (instead of using the Java API), there
are some parameters that have a special format:
- Colors: predefined
values are:
RED
WHITE
GREEN
BLUE
YELLOW
GRAY
DARKGRAY
BLACK
LIME
OLIVE
MAROON
NAVY
PURPLE
TELA
FUCHSIA
AQUA
ALICEBLUE
ANTIQUEWHITE
AQUAMARINE
|
AZURE
BEIGE
BLUEVIOLET
BROWN
BORLYWOOD
CORAL
CYAN
DARKGOLDENROD
DARKGREEN
DARKOLIVEGREEN
DARKORANGE
DARKORCHID
DARKSALMON
DARKTURQUOISE
DARKVIOLET
DEEPPINK
DEEPSKYBLUE
FORESTGREEN
GOLD |
GOLDENROD
GREENYELLOW
HOTPINK
INDIANRED
IVORY
LAVENDER
LAWNGREEN
LIGHTBLUE
LIGHTCORAL
LIGHTCYAN
LIGHTGRAY
LIGHTPINK
LIGHTSALMON
LIGHTSKYBLUE
LIGHTYELLO
LIMEGREEN
MAGENTA
MEDIUMBLUE
MEDIUMPURPLE
|
MIDNIGHTBLUE
ORANGE
ORANGERED
ORCHID
PALEGREEN
PALETURQUOISE
PALEVIOLETRED
PINK
PLUM
PURPLE
SALMON
SEAGREEN
SIENNA
SKYBLUE
SPRINGGREEN
TURQUOISE
VIOLET
YELLOWGREEN |
You can also use
the RGB numeric value of a color as parameter. For example "0xFF0000"
is red (RGB format), "00x00FF00" is green and so on.
- List of values.
List of values a separated by "|", only certain parameters like
FiIll styles uses another separator.
- Fonts have the
format <font name>|<style>|<size>. Style can be PLAIN, ITALIC
or BOLD. Example: "Arial|BOLD|12"
- Line styles have
the format <width>|<color>|<style>. Style can be LINE, DASHED
or DOTS. Example: "1|RED|LINE".
You can define transparency in line styles using an additional parameter:
<width>|<color>|<style>|<transparency>. <transparency>
is a value between 0 (full transparent) and 1 (opaque). We recommend 0.5.
- Fill style: there
are several options:
- <color>: for
plain color filling.
- <color>|<transparentcy>:
for transparent color filling. <transparency> is a value between
0 (full transparent) and 1 (opaque). We recommend 0.5.
Note: transparency will only work for jdk 1.2 or later (previous versions
will ignore it).
- <colorFrom>:<colorTo>:<orientation>:
for gadient filling. <orientation> can be VERTICAL or HORIZONTAL.
The fill style of following bar has been defined with "RED:ORANGE:HORIZONTAL".

as you can see the color changes from the <colorFrom> to the <colorTo>.
- <imageFile>.
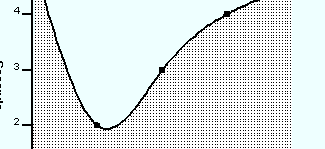
For patten filling. The following area chart uses a pattern filling defined
as "pattern1.gif"

where the patter file "pattern1.gif"
is:

Note: pattern filling is not supported by the SWT and Java 1.1 implementations.
RChart
Graphic Context Provider
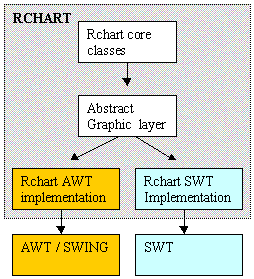
As you know rchart can
work in AWT/Swing mode or in SWT mode. For this reason, all graphic functions
which are specific to SWT or AWT are implemented in a package (com.java4less.rchart.gc)
which is an abstract layer above the specific graphic implementation (see diagram).

The default implemementation
is AWT, however you can switch to SWT by means of the following code:
GraphicsProvider.setMode(GraphicsProvider.MODE_SWT);
There is a third implementation
called AWT1 which is compatible with JDK1.1. If you select AWT and your current
Java version is 1.1, RChart will automatically select AWT1. In other other,
RChart will work with JDK 1.1 or later.
If you set the SWT mode
you must also provide a Display object which RChart will use for creating colors
and fonts:
SwtGraphicsProvider.setDefaultDisplay(display);
If you do not set the display,
RChart will create a new display. Since an application can only have 1 display
this might trigger an error.
This design also means
you should not use AWT or SWT font and color objects but RChart's abstract object
instead. There are 3 type of graphic object you are interested in if you are
going to create the chart using the Java API:
- Font: you create a font
in java code using the following call:
GraphicsProvider.getFont("Arial",ChartFont.PLAIN,10);
The parameters of the getFont() method are: font name, style (PLAIN, BOLD
or ITALIC) and size.
- Color: you create a
color in Java code using the following call:
GraphicsProvider.getColor(ChartColor.BLACK);
The parameters of the getColor()
method can be a color name (for example ChartColor.WHITE) or the RGB values
of the color. For example:
GraphicsProvider.getColor(<red>,<green>,<blue>);
where the RGB values are integers
between 0 and 255.
- Image: You must create
an image to be used in the chart (for example as background):
GraphicsProvider.getImageFromFile("myimage.gif");
