Annex A, RChart Visual Builder
Copyright 2005, J4L
Components (http://www.java4less.com)
Go bak to contents
Introduction
What
is RChart Visual Builder
RChart Visual Builder is a tool for
creating charts to be used with RChart. It is however optional ,
you don't have to use RChart Visual Builder if you don't want to. In this case
you can still manually create the parameters for Rchart.
the benefits of using RChart
Visual Builder are:
- you don't have to write much Java
source code in order to create charts.
- you will not make any mistakes
when typing parameters, since you visually define the chart.
- you will have an overview of the
available parameters.
- you will easily and quickly test
changes in you chart design.
this will result in shorter
learning and development times of charts.
Requirements
In order to run RChart Visual Builder
you need JDK 1.2 or later (1.3, 1.4 ...)
- JDK 1.2, you must also install
Swing (swingall.jar). If you don't have it you can dowload it here: The
Swing Connection.
- JDK 1.3 or later, already contains
the swing classes.
Note: Swing is needed it to run RChart
Visual Builder only, it is not needed for running RChart.
Note: Since RChart uses Swing, the
fonts can look slightly different if you later run the chart using SWT.
About
the evaluation version
If you are running the evaluation
version of RChart Visual Builder you must be aware of these limitations:
- a reminded will be displayed when
you start the application.
- you will not be able to save or
export your charts.
- you will only be able to see the
first 10 created parameters in the menu output->view.
Description
Starting
RChart Visual Builder
In order to start the application
you must execute bin/VisualBuilder.bat.
User
Interface
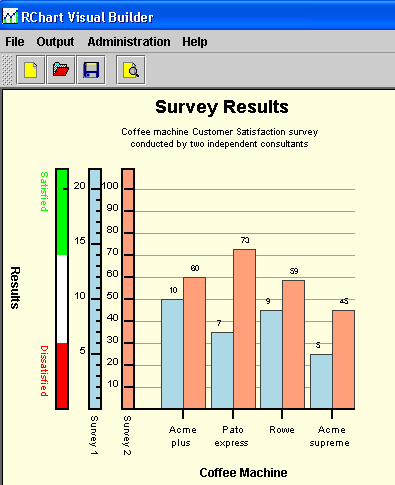
The user interface is made of the
following sections:
- the chart area: left window.
This area will display the created chart.
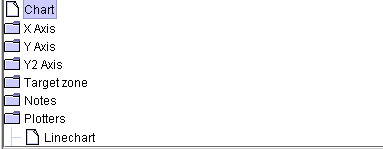
- The components tree. This
tree displays the components of the chart. Each chart can have the following
components:
- the
chart: this component stores some general configuration, like
chart's title, background color...
- the X axis:
each chart can have up to 3 X axis (a main axis and 2 secondary axis). You
can actually define more but RChart Visual Builder only allows you to enter
3.
- the Y axis:
each chart can have up to 3 Y axis (a main axis and 2 secondary axis).
- the Y2 axis:
each chart can have up to 3 Y2 axis (a main axis and 2 secondary axis).
- the target
zones : each chart
can have up to 5 target zones.
- the notes
: each chart can have
up to 5 notes.
- the
plotters: each chart can have several plotters, depending on
the kind of chart you create: linechart (for 2D/3D lines, areas, candlestick
and curves), barchart (2D/3D bars) piechart (2D/3D pies) and radarchart.
- the
series. RChart Visual Builder supports up to 9 series (RChart
supports however 50). In order to activate each serie you must enter a name
in the "name" field. If this field is empty, the serie
will not be used. Each serie represents, a line (if type is line) or a serie
of bars (if type is chart).
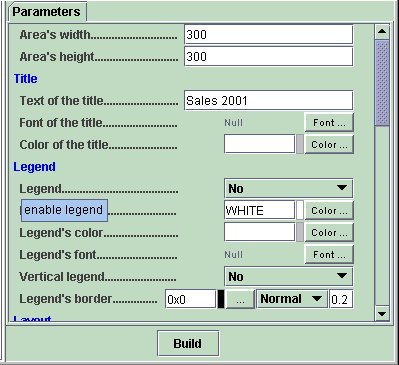
- Whenever you click on a component
in the tree window, the parameters for the selected component will be displayed
in the parameters window. In order to apply the changes of the parameters
and rebuild the chart click on the "Build" button. If you
move the mouse over the parameters name you will be able to see a short tip/description
of the same.
- the menu. It allows the following
operations:
- File->New: creates
new chart, current parameters will be lost.
- File->Load: loads
new parameters, current parameters will be lost.
- File->Save: saves
current chart parameters into a file.
- File->Exit: exits
application.
- Output->View: view
current parameters. You can copy and paste these parameters to use them
in your ASP, JSP or Php scripts.
- Output->Applet parameters:
creates a file that contains the parameters for the current chart to be
used as applet.
- Output->Servlet/Java
parameters: creates a file that contains the parameters for the current
chart to be used in a servlet or java program (see section "running
the chart").
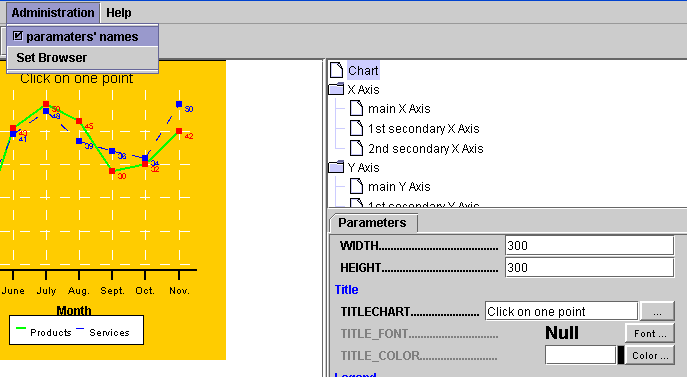
- Administration -> parameters'
names: if checked, the name of the parameters will be displayed instead
of the description (see screenshot below).
- Administration -> set
browser: you must select the browser executable in your computer in
order to be able to view the help files or run the chart on the browser.
- Help -> RChart Visual
Builder: view this file.
- Help -> RChart Parameters:
view the user guide.
- Help -> RChart JavaDoc:
view JavaDoc.
- Help -> About: displays
version.
If you are familiar with the format
of the parameters (color, fill styles ....) you can enter the value directly
in the field, however RChart Visual Builder provides specific forms for selecting
font, colors , line style and other types of parameters.
-
Fonts: in order
to select a font click on the "Font ..." button of a given parameter.
The following window will be displayed:
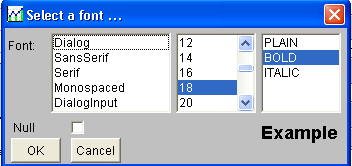
This window allows you to select a font type, size and style. You can also
set the font to null. For example you must set the SERIE_FONT_* parameter
to null if you want to remove the value labels from the chart.
- Colors: in order to select a font
click on the "Color ..." button of a color-type paramter. The following
window will be displayed:
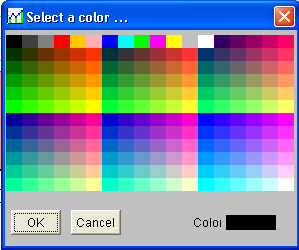
You just have to click on one of the color and the selected color will be
displayed in the Color field on the bottom right corner.
- Fillings. Parameters of type Fill
Style have a "Filling..." button as in the screenshot:

which display the following window:
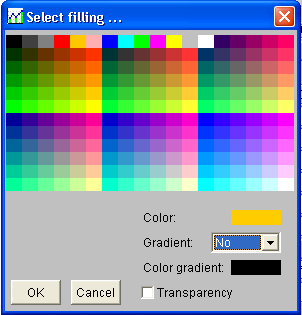
The window allows you to select a color and select the transparency option.
If you want to create a gradient filling you have to select the gradient type
and you will be able to alternatively select the "Color" and the
"Color gradient" values.
If you need to use an image as pattern filling you must enter the image file
name in the parameter field.
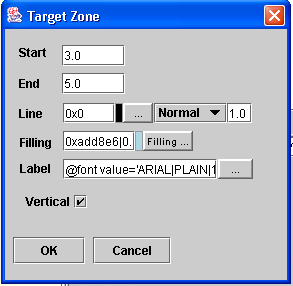
- Target zones parameters can be
defined using the following window, which allows you to select each of the
parameters a target zone is made of.
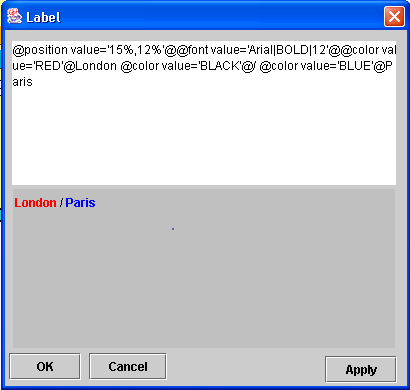
- Chart label can be defined using
the label markup language. The Label window allows you to test your label
by clicking on "apply". As you can see in the upper part of the
window you enter your label definition and in the lower part of the window
you can see the rendered label.
- Line styles parameters are entered
by selecting the folor, the type of line and the width:

- List of values (for example SERIE_DATA_*)
can be entered using the | as separator. You can also clik on the "list..."
button which allows you to enter the values one by one.

Limitations
When you build your chart using the
Visual Builder you must take into account that the following features are not
enabled inside the Builder:
- Zoom and scroll.
- Tips.
- Html links.
- Realtime features (automatic update
of the chart)
Running
the chart
Once your chart has been created
you can:
- view the parameters (menu->output->view).
You can copy and paste the parameters to use them in your ASP, JSP or Php
scripts.
- save the parameters to use them
in a java program (: menu->output->Servlet /Java parameters).
In this case you must use the following Java code:
// create chart
loader
ChartLoader loader=new ChartLoader();
// load paremeters
loader.loadFromFile("file://" + f[1]+f[0],true);
// create charts
Chart c=loader.build(false,false);
Note that some of the parameters
in your chart are constant, for example, your chart will always have a yellow
background color. However some other parameters will be variable, for example
the data to be plotted (parameter SERIE_DATA_*). You must of course change those
parameters at runtime:
- If you use java/jsp source code
you can change the parameters:
// create chart loader
chartLoader loader=new chartLoader(null);
// load paremeters
loader.loadFromFile("file://" + f[1]+f[0],true);
//
change the parameters you what here, for example, provide new data to
be plotted
loader.setParameter("SERIE_DATA_1","1|34|54")
// create charts
Chart c=loader.build(false,false);
- If you use java source code you
also change the chart once has been created (see RChart Javadoc):
// create chart
loader
chartLoader loader=new chartLoader(null);
// load paremeters
loader.loadFromFile("file://" + f[1]+f[0],true);
// create charts
Chart c=loader.build(false,false);
//
change first serie in plotter 0
c.plotters[0].replaceSerie(0,yourDataSerie);
Tutorial
Create
a line or bar chart, step by step
The following steps will show you
how to create a line chart that uses dates in the x axis:
- Start RChart Visual Builder
- Create a new chart with menu File->New.
- Click on the Chart node
of the components tree (top right corner of the window).
- Enter desired size of the chart
in the Area's width and height parameters. For example 400,400.
- Enter a title for you chart in
the "Text of the title" field. For example "My first
chart".
- Proceed now with the X Axis
- Click on the X Axis node
of the components tree.
- Enter title for the X Axis in
the "Text of the X label". For example "Date".
- Enter initial date "X initial
date" , for example "23-12-2001".
- Enter "d" in the "X
date step". In this way, each tick will stand for 1 day.
- Enter 7 in the "X big tick
interval" so that you get 1 big tick every 7 days.
- Proceed now with the YAxis
- Click on the Y Axis node
of the components tree.
- Enter 0 in the "Y Min"
field.
- Enter "10" in the "Y
auto ticks" so that you get only 10 ticks on the Y axis.
- Set "Y axis integer"
to "Yes", in order to avoid decimal values on the Y Axis labels.
- Proceed now with the Data to
be plotted
- Click on the Serie 1 node
of the components tree
- Enter a name for the serie in
the field "Name of the serie". For example "Sales".
- Enter the values to be plotted
in the "Data" field. For example: "10|23|45|24|45|67|86|23|43"
.
- Set Type to LINE in order
to get a line chart or BAR in order to get a bar chart.
- Select now color of the line in
the field:
- click on the Build button.
congratulations!, you have created
your first chart, you can now change some other parameters like colors, images,
line styles or fonts in order to make this simple chart look a bit nicer.
Create
a pie chart, step by step
The following steps will show you
how to create a pie chart:
- Start RChart Visual Builder
- Create a new chart with menu File->New.
- Click on the Chart node
of the components tree (top right corner of the window).
- Enter desired size of the chart
in the Area's width and height parameters. For example 400,400.
- Enter a title for you chart in
the "Text of the title" field. For example "My first
chart".
- Proceed now with the Data to
be plotted
- Click on the Serie 1 node
of the components tree.
- Enter a name for the serie in
the field "Name of the serie". For example "Test".
- Set Type to PIE.
- Set now the values in the "Data"
field, for example "10|45|67". This will be the values for each
item of the pie.
- Enter now the names of the items.
- Enter the name in the "Item
name 1" field of the "PieChart" section of the "Serie
1", for example "Item A".
- Enter the name in the "Item
name 2" field of the "PieChart" section of the "Serie
2", for example "Item B".
- Enter the name in the "Item
name 3" field of the "PieChart" section of the "Serie
3", for example "Item C".
- Enter now the colors for the items
of the pie.
- Select a color in the "Item
style 1" field of the "PieChart" section of the "Serie
1"
- Select a color in the "Item
style 2" field of the "PieChart" section of the "Serie
2"
- Select a color in the "Item
style 3" field of the "PieChart" section of the "Serie
3"
- click on the Build button.
congratulations!, you have created
your first chart, you can now change some other parameters; Click on the "Piechart"
node of the components tree to change the aspect of the pie.
Examples
The subdirectory "data/examples"
contains several files you can load into RChart Visual Builder. We recommend
you to use this examples as start point for your own charts.