Home
go to main page
|
Gallery of features
screenshots of main features
|
Download
evaluate the product
|
Order
order full version
|
|
|
|
|
|
Gallery of features
|
|
|
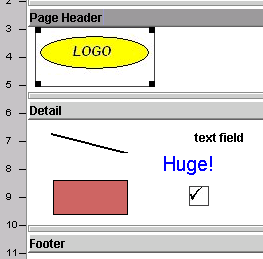
Components
- The main components
are text fields (different fonts and colors), images ("logo"),
lines, rectangles ( filled or not) and checkboxes.
|
|
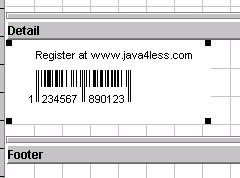
- Our barcoding
software, RBarcode, can be very easily integrated in the reports using
the rreport's barcode component.
|
|
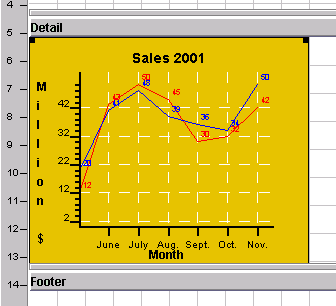
- Our charting
software, RChart, can be very easily integrated in the reports using
the rreport's chart component.
|
|
|
Designing
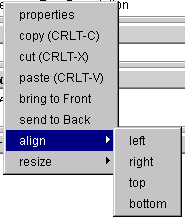
- Components are
selected from the toolbar and dropped on the report.
|
|
- Components can
be moved, copied, aligned, resized ...
|
|
- The system variables
[page] and [date] are used for the current page and
date.
|
|
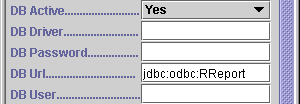
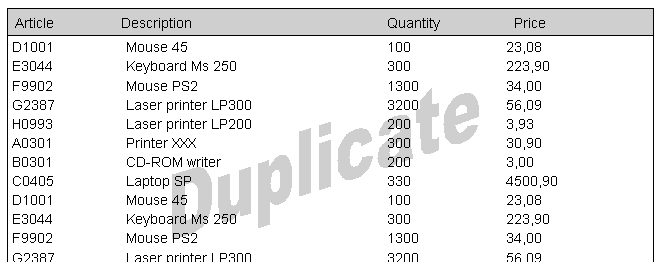
- Data can be retrieved
from a database using jdbc drivers.
|
|
|
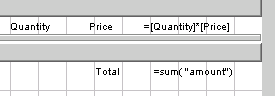
- Fields can contain
calculated values/expressions
|
|
|
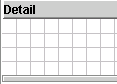
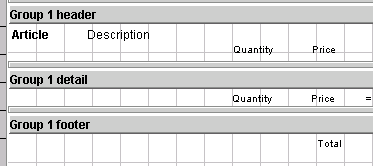
- Groups of areas
are used for data grouping.
|
|
- Grid can be enabled
or disabled. Components can be forced to align to the grid.
|
|
- The PDF output
of the report can be very easily tested by just pressing a button
in RReport Visual Builder.
|
|
- The DHTML output
of the report can be very easily tested by just pressing a button
in RReport Visual Builder. It can create HTML links for the components
of the report.
|
|
Preview
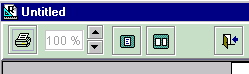
- The preview window
(either AWT or Swing) can display 1 or 2 pages at a time. It can also
perform a zoom on the image of the page.
|
|
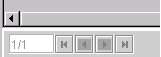
- The preview window
allows you to browser through the pages of the report using the "first",
"previous", "next" and "last" buttons.
|
|
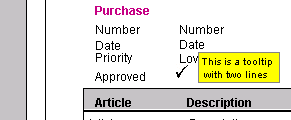
- Components of
the reports can be assigned a tooltip that will be displayed in the
preview window. A user program can also be executed when the user
clicks on a component.
|
|
|
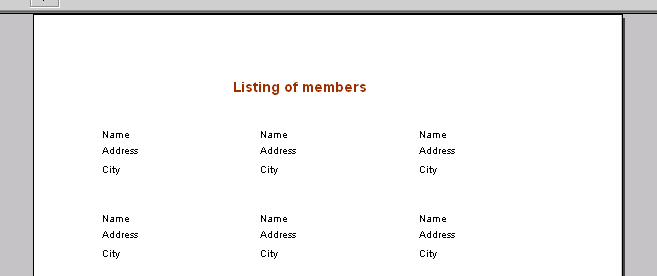
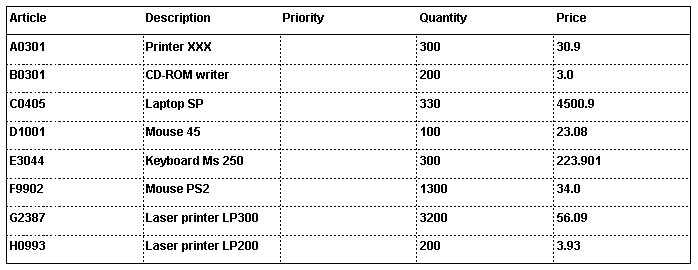
Examples
of reports
- Printing backgrounds
and filling areas.
|
|
|
|
- Areas printed
in 3 columns.
|
|
|
|
|
|
|
|
|
|
|
|
|
|
|
|
|
|
|
|
|
|
|
|