Copyright 2011, J4L
Components (http://www.java4less.com)
Go bak to contents
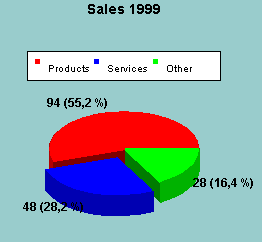
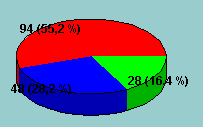
The following is a complete example of a Piechart:
|
Parameters
|
Description
|
Equivalent Ruby class/property
|
|
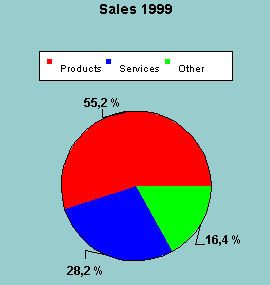
TITLECHART=Sales 1999 |
Text of the title |
J4LChart::Title.new("...") serie.itemsTogether=detachedFlags
|
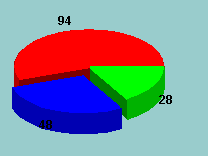
The SERIE_TOGETHER_1 parameters is used to control which slices are detached from the pie.
|
Parameters
|
Description
|
Equivalent Ruby class/property
|
|
SERIE_TOGETHER_1=true|true|true |
No detached slices |
see detachedFlags in the constructor of PieDataSerie |
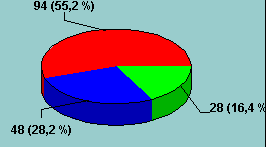
The size of the pie can be changed using the PIECHART_RADIUS parameter.
|
Parameters
|
Description
|
Equivalent Ruby class/property
|
|
PIECHART_RADIUS=0.5 |
Half of the size of the normal size (default is 1) |
piePlotter.radiusModifier=0.5 |
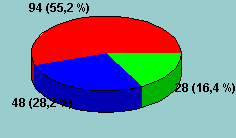
The SERIE_DISTCENTER_1 defines the position of the labels:
|
Parameters
|
Description
|
Equivalent Ruby class/property
|
|
SERIE_DISTCENTER_1=0.5 |
default is 1. |
serie.textDistanceToCenter=0.5 |
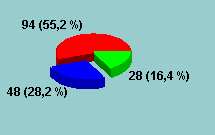
You can also place the labels outside the pie and draw lines from the slice to the labels:
|
Parameters
|
Description
|
Equivalent Ruby class/property
|
|
PIE_LABEL_LINE=0.2|#000000|NORMAL |
Draw label lines |
piePlotter.labelLine= J4LChart::LineStyle.new(...) |
If you set PIECHART_3D to false, a 2D pie will be painted:
|
Parameters
|
Description
|
Equivalent Ruby class/property
|
|
PIECHART_3D=false |
2D pie |
piePlotter.effect3D=false |
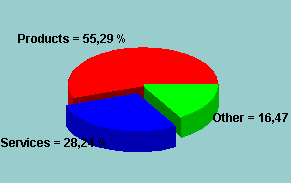
You can define the format of the labels using PIE_LABEL_FORMAT. The following variables can be use: #VALUE#, #PERCENTAGE# and #LABEL#. For example, the following format: "#LABEL# = #PERCENTAGE#" would produce this output: "ItemA = 35%". See SERIE_LABELS parameter.
|
Parameters
|
Description
|
Equivalent Ruby class/property
|
|
PIE_LABEL_FORMAT=#LABEL# = #PERCENTAGE# |
Format of the labels in the pie |
piePlotter.labelFormat |
SERIE_PERCENTAGES_1: "True" or "False". If true the labels will be displayed as percentage, if false as absolute value.Only used if the PIE_LABEL_FORMAT parameter is empty.
|
Parameters
|
Description
|
Equivalent Ruby class/property
|
|
SERIE_PERCENTAGES_1=FALSE |
Absolute values will be displayed as label (not percentages). |
serie.drawPercentages=false |