Name
Code
Result
@position value='30%,90%'@@size value='0px,22px'@@border value='1|BLACK|NORMAL'@@background value='WHITE'@@font value='Arial|BOLD|12'@ Last year
![]()
Copyright 2011, J4L
Components (http://www.java4less.com)
Go bak to contents
J4L-Chart provides several
properties and parameters to define the text to be used as title, labels for
the axis , labels for the values and other. It also provides a way to select
the color and font to be used in each case.
Starting with version 2.1 you can also use the label markup language to define
the appearance of the labels. The language allows you to:
The language is made of tags which are inserted in the label's text and processed by J4L-Chart before rendering the text. The format of the tags is:
@tagname attributename1='value' attributename2='value' ....@
Tags start with the character @, followed by the tagname and one or more attributes. Each attribute is made of the attribute name followed by the equal (=) sign and the value enclosed in single quotes ( ' ). Most tags have only 1 attribute , called value. Tags must end with the character @.
There are 2 kind of tags:
The following table shows all available tags
|
Tag name (and type)
|
Attributes
|
Description and example
|
|
|
Name of the label (optional). The name can be used in java code to identify which label has been clicked. You can use chart.selectedLabel.getName() to read the name of the clicked label. |
|
|
Tip of the label (optional) |
|
|
Background color of the label. Example: @background value='RED'@ |
|
|
Line style of the border. Example: @border value='1|BLACK|NORMAL'@ |
|
|
Additional information. It is normally
used to hold a html link which will be opened when the user clicks on the
label. You can use chart.selectedLabel.getClickInfo() to read the
value of the property in your java code. |
|
|
Use this tag to rotate the label. Valid values are: 0,45,90,180 and 270. For example: @rotation value='90'@ |
|
|
Use this tag to change the default position of the label. You can define the position using axis units, pixels or percentages. For example:
You can also use the signs + / - to defined a relative position. For example: @position value='+10px,+0px'@ will paint the label ten pixels to the right of the default position.
|
|
|
Use this tag to change the alignment of the text and images in the label. Valid values are LEFT, CENTER and RIGHT. |
|
|
Use this tag to change the size of the label (see also position tag) |
|
|
The tag allows you to paint a line from the label to an "anchor" point. The value attribute contains the position of the point and the line attibute the style of the line. For example: @ANCHOR value='1,2' line='1|GREY|DOTS'@ |
|
|
The margin allows to increase the distance between the text in the label and the border. A margin of 3 pixels is defined as: @margin value='3'@ |
|
|
Use this tag to select the current font color. The new color will be applied to the text after the font tag only. For example: @color value='RED'@ |
|
|
The font is used to change the current font. The new font will be applied to the text after the font tag only. For example: @font value="arial|PLAIN|10'@ |
|
|
Adds an image to the label. For example: @image value='myImage.gif'@ |
|
|
You can use the string \n (in java code defined as "\\n"
) to create a new line in your text. |
The following table includes some examples and the resulting image:
|
Name
|
Code
|
Result
|
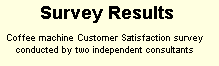
| Changes of fonts in the label. | @align value='CENTER'@Survey Results\n@Font value='Arial|PLAIN|9'@Coffee machine Customer Satisfaction survey\nconducted by two independent consultants |
|
| Changes of colors in the label. | @position value='15%,12%'@@font value='Arial|BOLD|12'@@color value='RED'@London @color value='BLACK'@/ @color value='BLUE'@Paris | |
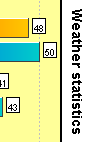
| Rotation of the text | @position value='72%,20%'@@rotation value='90'@@font value='Arial|BOLD|14'@Weather statistics |
|
| Border and background |
@position value='30%,90%'@@size value='0px,22px'@@border value='1|BLACK|NORMAL'@@background value='WHITE'@@font value='Arial|BOLD|12'@ Last year
|
|
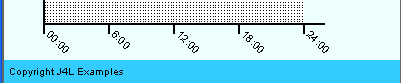
| Adding line to anchor point | @position value='0px,94%'@@size value='100%,6%'@ @background value='0x33ccff'@Copyright J4L Examples |
|
| Adding an image | @image value='rain.gif'@\n\nRainy |
|
| Setting size and position | @position value='0px,94%'@@size value='100%,6%'@ @background value='0x33ccff'@Copyright J4L Examples | |
Note: there are two parameters; SERIE_LABEL_TEMPLATE_* and *AXIS_TEMPLATE which are used to define the label of the value in the chart and the axis. These label must contain the literal #value# which will be replace at runtime with the value to be plotted.
Target zones are used in line and bar charts to remark a range of values in the plotter area. The follwing screenshot shows a chart with 2 target zones:
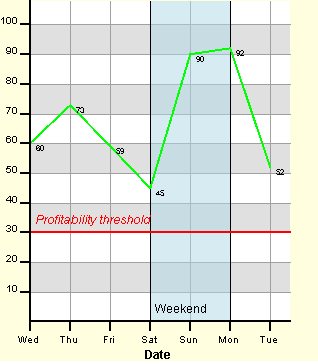
As you can see target zones can be lines or areas (with start and end positions). The CHART_TARGET_ZONE_* parameters are used to add target zones to the charts. The syntax of the parameter is:
CHART_TARGET_ZONE_*=<start value>;<end value>;<line style>;<fill style>;<label>;<orientation>
where:
The 2 zones in the example above are defined as:
|
Parameters
|
Equivalent Ruby class/property
|
|
CHART_TARGET_ZONE_1=3;5;1|BLACK|NORMAL;LIGHTBLUE|0.5;@font value='ARIAL|PLAIN|12'@@Position value=',-25px'@Weekend;TRUE CHART_TARGET_ZONE_2=30;;2|RED|NORMAL;;@Position value='15%,-25px'@@font
value='ARIAL|ITALIC|12'@Profitability threshold;FALSE CHART_TARGET_ZONE_2=30%;;2|RED|NORMAL ..... will create a target zone at position 30% of the Y axis (if vertical, or x axis if horizontal). |
value="3;5;1|BLACK|NORMAL;LIGHTBLUE|0.5;@........" OR zone= J4LChart::TargetZone.new(3,5, J4LChart::UNIT_USER,
J4LChart::UNIT_USER) zone= J4LChart::TargetZone.new( 3, J4LChart::DISABLED,
J4LChart::UNIT_USER, J4LChart::UNIT_USER) |
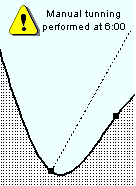
Notes are chart labels which you define using the label markup language. The label includes always the position tag since notes have no default position and you must specify it.
The following example shows a chart note:
Notes are created using
the CHART_NOTE* parameter(where * is a counter starting at 1).
|
Parameters
|
Equivalent Ruby class/property
|
|
CHART_NOTE1=@image value='warning.PNG'@ @ANCHOR value='1,2' line='1|GREY|DOTS'@ @position value='15%,15%'@Manual tunning\n performed at 6:00 |
note="=@image value='warning.P......" chart.addNote(note) |
When you create a linechart or barchart you will normally display the values next to the bar , point or line.
The format of the values can be configured using several parameters:
The following table shows
the equivalent java properties for the parameters:
|
Parameters
|
Equivalent Ruby class/property
|
|
SERIE_FORMAT_1=#### SERIE_DATA_LABELS_1=one|two|three |
dataSerie.valueFormat="####" |