Copyright 2011, J4L
Components (http://www.java4less.com)
Go bak to contents
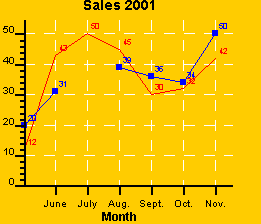
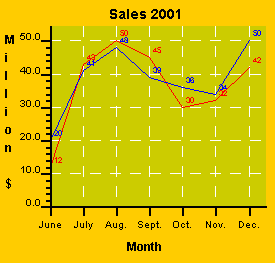
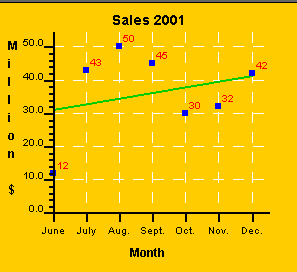
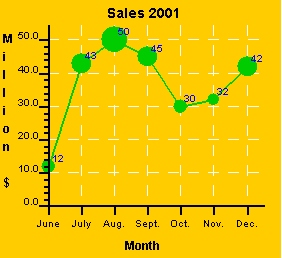
The following table constains an example of a linechart with 2 lines (series):
|
Parameters
|
Description
|
Equivalent Ruby class/property
|
|
TITLECHART=Sales 2001 |
Title |
J4LChart::Title.new("Sales 2001") |
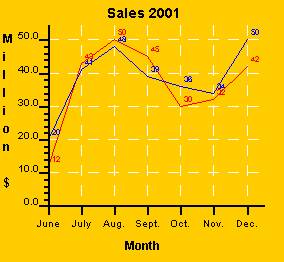
If you want to have a fixed maximum value for your Y Scale and leave some points outside the chart you can do it like this:
|
Parameters
|
Description
|
Equivalent Ruby class/property
|
|
YSCALE_MAX=50 |
Definition of the scale |
chart.xAxis.scale.max=50 |
the result is:
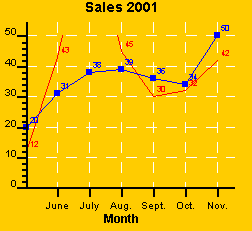
If you serie has some missing points you can use NULL as value to paint a discontinued line. This feature is not compatible with (LINECHART_FIXED_LIMITS=TRUE)
|
Parameters
|
Description
|
Equivalent Ruby class/property
|
|
YSCALE_MAX=50 |
Definition of the scale |
|
As you see the blue series does not a value for July.
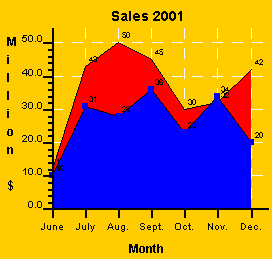
Areacharts are exactly like linecharts, you only need to provide a fill color for the area. When designing these kind of charts keep in mind that serie 1 is painted first (in the background) and serie 2 in the foreground.
|
Parameters
|
Description
|
Equivalent Ruby class/property
|
|
SERIE_STYLE_1=0.2|0000|NORMAL |
Black line used as border |
see lineStyle in LineDataSerie constructor |
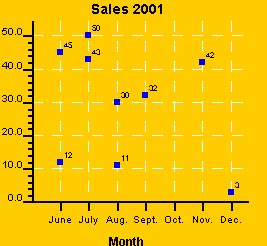
Scatter chart are linecharts where:
For example:
|
Parameters
|
Description
|
Equivalent Ruby class/property
|
|
SERIE_DATA_1=12|43|50|45|30|32|42|3|11 |
Y Values |
serie1= J4LChart::LineDataSerie.new(lineStyle,values) |
Other usefull parameters are:
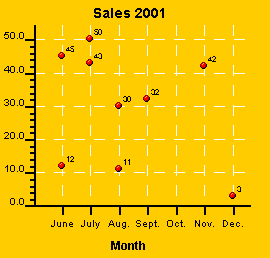
You can also use images instead of squares for plotting the points:
|
Parameters
|
Description
|
Equivalent Ruby class/property
|
|
SERIE_POINT_IMAGE_1=point.gif |
Use point.gif as image for the points |
serie1.icon=image |
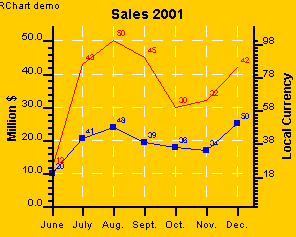
If you want to have 2 Y axis you must use the following parameter:
|
Parameters
|
Description
|
Equivalent Ruby class/property
|
|
SERIE_SECONDYAXIS_2=TRUE |
Second serie (blue) uses axis Y2 (right Y axis) |
serie1.secondYAxis=true |
It is possible to define a different color for the chart's background and the plotter's background:
|
Parameters
|
Description
|
Equivalent Ruby class/property
|
|
CHART_FILL= #ffcc00 |
Background color of the chart. |
chart.back= J4LChart::GraphicsProvider.getcolorRGB(#ff,#cc,00) |
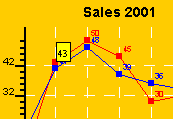
You can add tips to the points of your chart like this:
|
Parameters
|
Description
|
Equivalent Ruby class/property
|
|
SERIE_POINT_1=TRUE |
Tips require points to be activated |
|
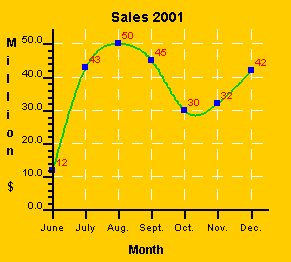
J4L-Chart offers you 3 type of curves:
|
Parameters
|
Description
|
Equivalent Ruby class/property
|
| SERIE_TYPE_1=CURVE | Use cubic natural curves |
plot= J4LChart::CurvePlotter.new() |
|
Parameters
|
Description
|
Equivalent Ruby class/property
|
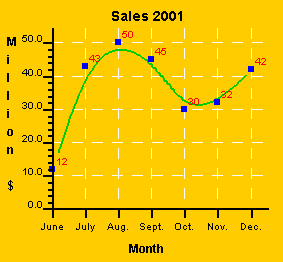
| SERIE_TYPE_1=B-SPLINES | Use B-SPLines |
plot= J4LChart::CurvePlotter.new() |
|
Parameters
|
Description
|
Equivalent Ruby class/property
|
| SERIE_TYPE_1=LINE_LEAST_SQUARES | Use least squares |
plot= J4LChart::CurvePlotter.new() |
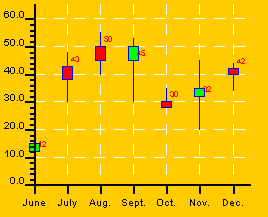
In order to create a Candlestick chart you must use the following additional parameters:
|
Parameters
|
Description
|
Equivalent Ruby class/property
|
|
SERIE_DATA_1=12|43|50|45|30|32|42 SERIE_MAX_DATA_1=18|48|55|53|35|45|44
SERIE_MIN_DATA_1=20|30|40|30|28|20|34 SERIE_CLOSE_DATA_1=15|38|45|50|28|35|40
|
Open values Maximum values Minimum values Close values Select candlestick type Color of candlesitck is open<close Color of candlesitck is open>close Style of the line |
serie= J4LChart::MaxMinDataSerie.new(lineStyle,values) |
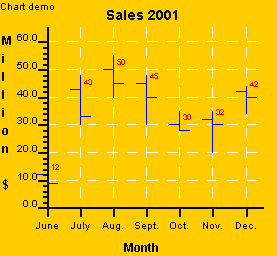
If you want to create a OHLC chart you must change the SERIE_LINE_TYPE_1 parameter:
|
Parameters
|
Description
|
Equivalent Ruby class/property
|
| SERIE_DATA_1=12|43|50|45|30|32|42
SERIE_MAX_DATA_1=18|48|55|48|35|35|44 SERIE_MIN_DATA_1=8|30|40|30|28|20|34 SERIE_CLOSE_DATA_1=9|33|45|40|28|30|40 SERIE_LINE_TYPE_1=OHLC SERIE_OPENCLOSE_WIDTH_1=10 |
Open values Maximum values Minimum values Close values Select OHLC type Length of the open/close lines |
serie= J4LChart::MaxMinDataSerie.new(lineStyle,values) |
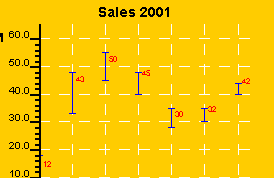
If you only want to display the maximum and minimum values (no open/close values) you can use:
|
Parameters
|
Description
|
Equivalent Ruby class/property
|
|
SERIE_LINE_END_1=TRUE |
Draw line
end. Open values Maximum values Minimum values |
|
Bubblecharts will draw a circle around points of the line. The radius of the circle is defined using the SERIE_MAX_DATA_* parameter.
For example:
|
Parameters
|
Description
|
Equivalent Ruby class/property
|
| SERIE_BUBBLE_1=TRUE SERIE_FILL_BUBBLE_1=TRUE SERIE_DATA_1=12|43|50|45|30|32|42 SERIE_MAX_DATA_1=2|3|4|3|2|2|3|2 |
Activate
bubbles Bubbles should be filled Values of the points Values of the radius of the bubbles in (Y axis units) |
maxMinDataSerie.bubbleChart=true |
if you want to remove the line and only point the bubbles you must use SERIE_DRAW_LINE_1=false;
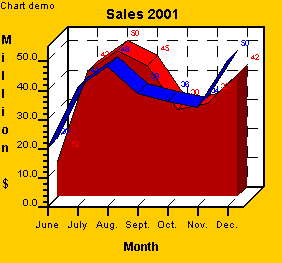
In order to create a 3D linechart you only need to add the parameter: SERIE_TYPE_1=LINE3D (or use LinePlotter3D in java code).
The order 3D specific parameters are:
|
Parameters
|
Description
|
Equivalent Ruby class/property
|
|
SERIE_TYPE_1=LINE3D |
Use 3D
lines Length of the Z axis (depth) Border of the surface of the line. Space between lines. |
linePlotter3D= J4LChart::LinePlotter3D.new() |
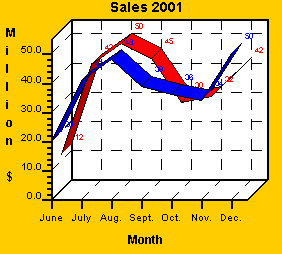
As in the 2D lineharts you can create an arechart by adding the fill color for the area.
|
Parameters
|
Description
|
Equivalent Ruby class/property
|
|
SERIE_FILL_1=#ff0000 |
Fill area with red color |
serie1.fillStyle= J4LChart::FillStyle.new( J4LChart::GraphicsProvider.getcolor(
J4LChart::RED))
|