Copyright 2011, J4L
Components (http://www.java4less.com)
Go bak to contents
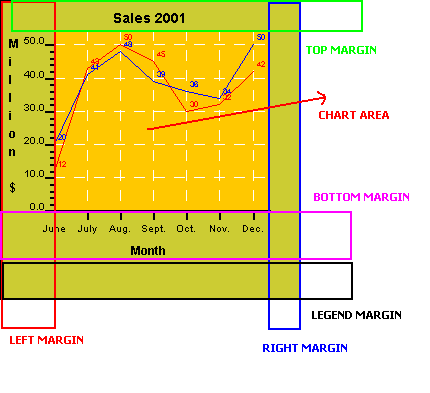
Charts are made of the following 6 areas (See example):
The previous example was created with the following parameters:
|
Parameters
|
Description
|
Equivalent Ruby class/property
|
|
| LEFT_MARGIN=0.18 RIGHT_MARGIN=0.1 TOP_MARGIN=0.1 BOTTOM_MARGIN=0.1 LEGEND_MARGIN=0.2 LEGEND_POSITION=BOTTOM LEGEND=FALSE |
18 % of the width (default
is 12.5%) 10 % of the width (default is 12.5%) 10 % of the height (default is 12.5%) 10 % of the height (default is 12.5%) 20 % of the height (default) Legend is at the bottom (default is RIGHT) Do not display legend, leave space empty (default is TRUE) |
chart.leftMargin=0.18 |
A margin of 0.18 means 18% of the width (or height) of the chart.
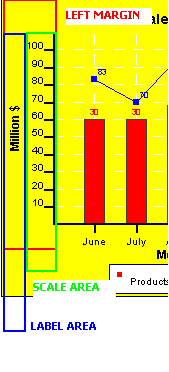
The space reserved for the axis is divided in 2 areas of equal size:
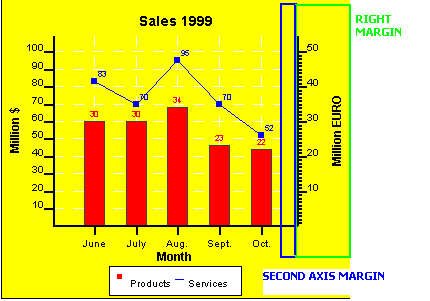
if you are using a second Y2 axis, there is an additional parameter:
|
Parameters
|
Description
|
Equivalent Ruby class/property
|
| CHART_SECOND_AXIS_MARGIN=0.05 | 5 % of the width |
chart.secondYAxisMargin=0.05 |
That is the blue rectangle in the screenshot. This parameter is normally set to 0 (default).
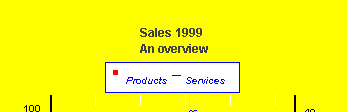
As already stated, the title is painted in the area reserved by the top margin parameters. The following parameters control the title:
|
Parameters
|
Description
|
Equivalent Ruby class/property
|
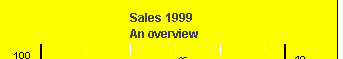
| TITLECHART=Sales 1999 \n An overview TITLE_FONT=Dialog|BOLD|12 TITLE_COLOR=#404040 |
Text of
the title, you can use "\n" to create a new line. Font of the title. Color of the text. |
chart.title= J4LChart::Title.new("Sales 1999 \\n An overview") chart.title.font= J4LChart::Graphicsprovider.getfont( "Dialog",
J4LChart::BOLD,12) |
The result of the above parameters is:
The legend is the small box next to the chart that describes the content of the chart. The legend is placed in the space reserved by LEGEND_MARGIN and at the position specified by LEGEND_POSITION which can be TOP, BOTTOM or RIGHT.
|
Parameters
|
Description
|
Equivalent Ruby class/property
|
| LEGEND_FILL=WHITE LEGEND_COLOR=#0000ff LEGEND_FONT=Dialog|ITALIC|10 LEGEND_VERTICAL=FALSE LEGEND_BORDER=0.2|#0000ff|NORMAL LEGEND_POSITION=TOP LEGEND_MARGIN=0.12 |
Background
color of the legend Color of the font Font Layout of the legend (vertical or horizontal) Style of the line of the border Position Reserved area |
chart.legend.background= J4LChart::FillStyle.new(J4LChart::WHITE) |
The result of the above parameters is: