Copyright 2005, J4L
Components (http://www.java4less.com)
Go bak to contents
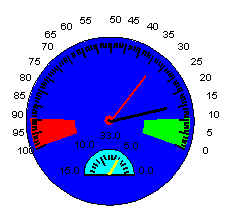
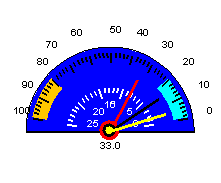
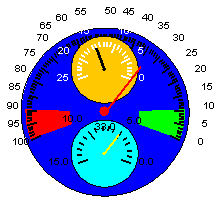
This is a complete example of a gaugechart with 2 subgauges:
|
Parameters
|
Description
|
Equivalent java class/property
|
|
YLABEL_COLOR=0xffffff |
|
|
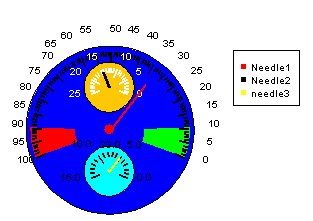
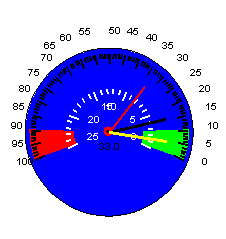
The subgauges are enabled with:
In this case the last (or last two) value of the SERIE_DATA_1 parameter will be used in the subgauge1 (and/or subgauge2). In this example, the value 15 is used for subgauge1 and the value 5 for the subgauge 2.
Parameters of the gauge marked with (*) can be used to defined the subgauges by adding "1" or "2" to the "GAUGE" word in the parameter's name. For example: GAUGE1_BORDER,GAUGE1_BASE,GAUGE2_BORDER,GAUGE2_BASE and so on.
|
Parameters
|
Description
|
Equivalent java class/property
|
|
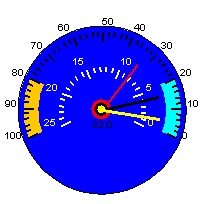
YAXIS=FALSE |
remove second scale |
gaugePlotter.axis2=null; |
Gaugechart needs at least 1 scale, defined using the XAXIS* parameters. You can define a second scale for the gauge using the YAXIS* parameters. However, if you have defined subgauges, the YAXIS* scale will be used for subgauge1 and the Y2AXIS* scale parameters will be used for subgauge2.
|
Parameters
|
Description
|
Equivalent java class/property
|
|
YAXIS=TRUE |
Creates second scale (the one in white) |
gaugePlotter.axis2=YAxis; |
The following parameters are used to configure the green and red areas:
|
Parameters
|
Description
|
Equivalent java class/property
|
|
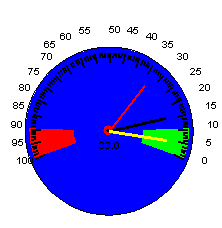
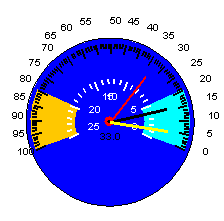
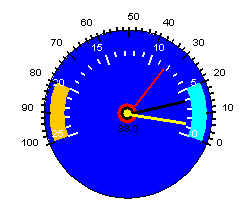
GAUGE_MAX_ZONE=80 |
Orange area starts at pos. 80 |
gaugePlotter.maxZone |
You can also change the size of the circle at the base of the needle.
GAUGE_BASE (*): Size of the circle painted as needle base (% of the radius). Default is 6 which mean 6% of the size of the gauge
|
Parameters
|
Description
|
Equivalent java class/property
|
|
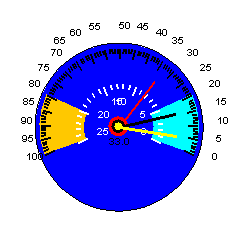
GAUGE_BASE=12 |
Size of the red circle at the base |
guagePlotter.needleBase |
You can change the width of the areas that mark the max and min zones:
GAUGE_MAXMIN_ZONE_WIDTH(*):
Width in pixels of the ring for the max and min zones. Default is 50.
|
Parameters
|
Description
|
Equivalent java class/property
|
|
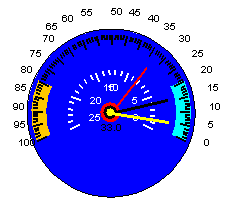
GAUGE_MAXMIN_ZONE_WIDTH=15 |
width in pixels of the orange and cyan areas (default is 50). |
gaugePlotter.maxminZoneWidth=15; |
You can change the margin of the areas that mark the max and min zones:
GAUGE_MAXMIN_ZONE_MARGIN(*):Margin, in pixels (distance to border) of the min/max area. Default is 5.
|
Parameters
|
Description
|
Equivalent java class/property
|
|
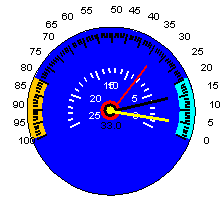
GAUGE_MAXMIN_ZONE_MARGIN=0 |
Cero means, the area starts at the border. |
gaugePlotter.maxminZoneMargin=50; |
The following parameters are used to change the start and end possition (angles) of the gauge:
|
Parameters
|
Description
|
Equivalent java class/property
|
|
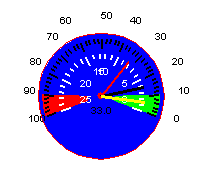
GAUGE_START_ANGLE=10 |
Scale starts at angle 10 and ends at angle 170 |
gaugePlotter.startAngle=10; |
In order to change the possition of the labels of the scale you must use:
|
Parameters
|
Description
|
Equivalent java class/property
|
|
GAUGE_AXIS1_LABEL_MARGIN=7 |
|
gaugePlotter.axis1LabelMargin |
These parameters are used to change the possition of the scale:
|
Parameters
|
Description
|
Equivalent java class/property
|
|
GAUGE_AXIS1_MARGIN=-4 |
Ticks start 4 pixels outside the gauge. |
gaugePlotter.axis1Margin |
The size of the gauge and subgauges can be defined with:
|
Parameters
|
Description
|
Equivalent java class/property
|
|
GAUGE_BORDER=0.2|0xff0000|NORMAL |
Red border of the gauge (also GAUGE1_BORDER, GAUGE2_BORDER) |
gaugePlotter.border |
|
Parameters
|
Description
|
Equivalent java class/property
|
|
GAUGE_SUBGAUGE_SIZE=40 |
Size of the subgauges |
gaugePlotter.subGaugeSize=40; |
A gauge can contain up to 2 subgauges. In order to activate the subgauges you
must set GAUGE2_ENABLE:
|
Parameters
|
Description
|
Equivalent java class/property
|
|
GAUGE2_ENABLE=TRUE |
Activate subgauge 2 |
|